
Figure 1.
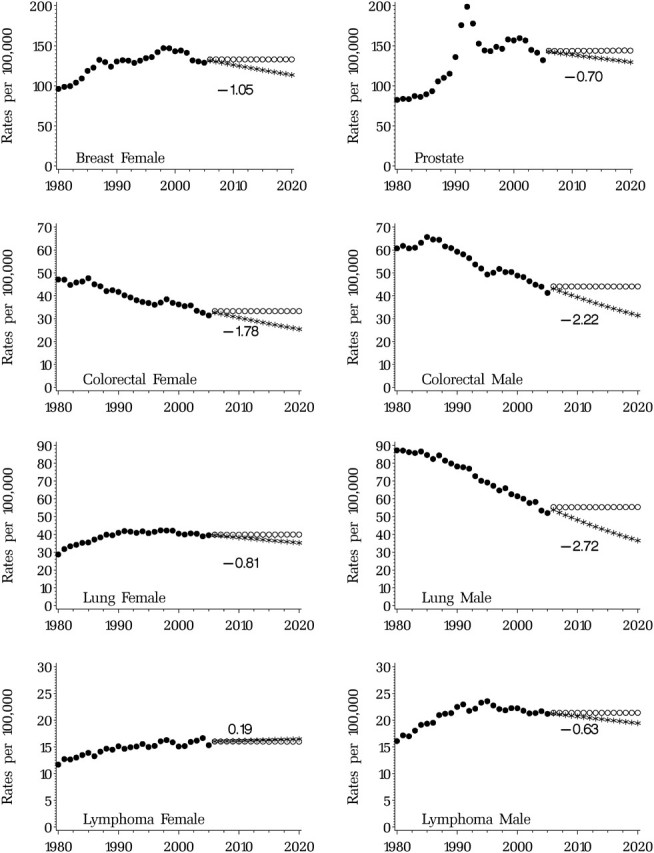
Observed age-adjusted incidence (solid circles) and projected age-adjusted incidence under the assumption of future constant incidence (open circles) and continuing incidence trend (asterisks). The number represents the estimated annual percent change from 1996 through 2005.