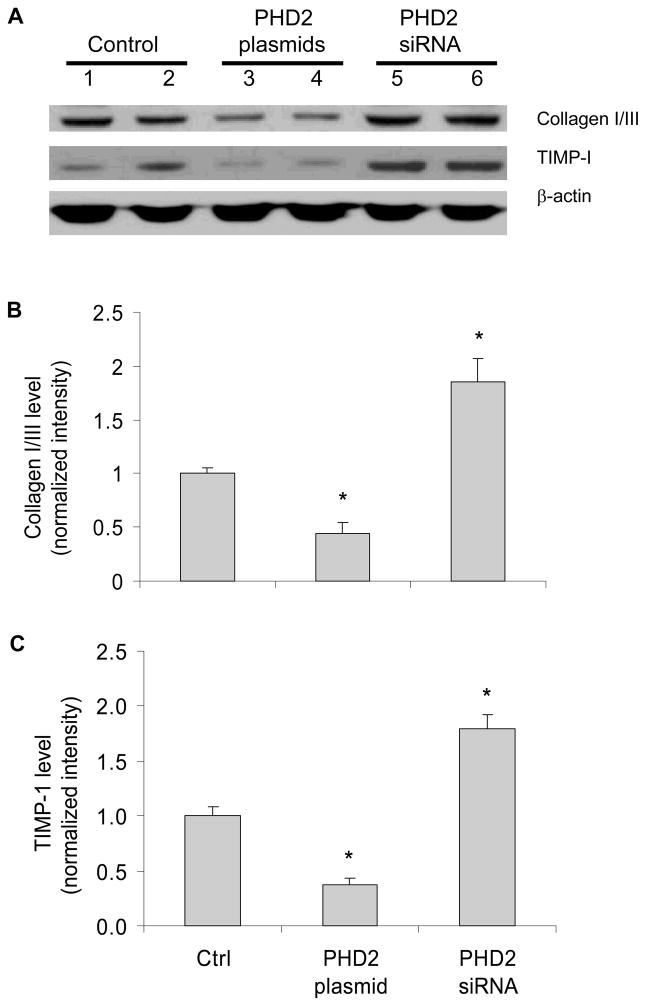
Figure 5. Effect of PHD2 or PHD2 siRNA expression vectors on the levels of collagen I/III and TIMP-1 in RMICs by Western blot analysis.
Panel A: representative ECL gel documents of Western blot analyses depicting the protein levels of collagen I/III and TIMP-1. Panel B and C: summarized intensities of collagen I/III and TIMP-1 blots normalized to control. *P < 0.05 vs. all other groups (n=6).

