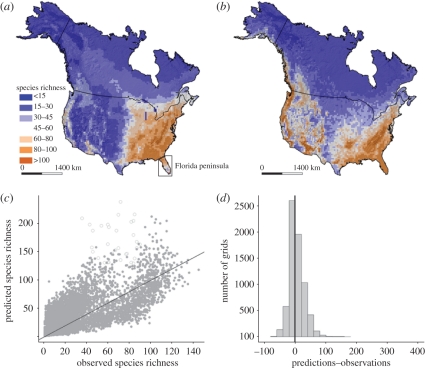
Figure 3.
(a,b) Geographical patterns of the observed species richness of trees in North America (a) and the predictions of our model (b). (c,d) The relationships between the predictions and observations and the frequency distribution of the distances between the predictions and the 1 : 1 line. (c) Circles represent the grids in the Florida peninsula (demonstrated in (a)), and the solid line is the 1 : 1 line.

