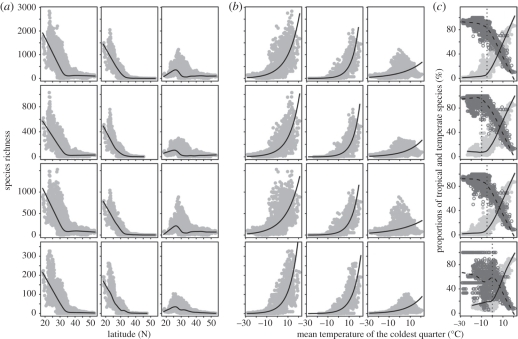
Figure 5.
(a,b) The richness and (c) proportions of the species with tropical (dots and solid lines in (c)) and temperate (circles and dashed lines in (c)) affinities along the gradients of latitude and the mean temperature of the coldest quarter (MTCQ). In (a,b) the first column of graphs represents species richness; the second column, tropical; and the last column, temperate. From the top down, the four rows represent all woody plants, trees, shrubs and woody lianas, respectively. The solid lines in (a,c) are predicted by LOWESS method, and those in (b) by generalized linear models with Poisson residuals.

