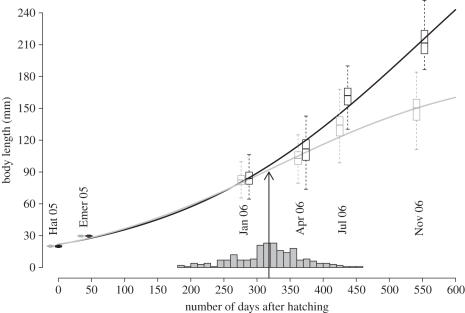
Figure 1.
Growth patterns observed for sneaker (grey) and faster-growing (black) males throughout the experiment. Boxes encompass the interquartile range of the observed data, with the medians represented by the dark lines drawn midpoint in the box. The whiskers extend to approximately 2 s.d. of the data. The curves represent the growth trajectories of each life history based on a logistic function. Labels within the figure indicate the month when sampling was conducted. From left to right: hatching (Hat 05) and emergence (Emer 05) in 2005, and January (Jan 06), April (Apr 06), July (Jul 06) and November (Nov 06) in 2006. The grey bars represent the distribution of the timing of early sexual maturation for 216 sneaker males. After removing two outliers, this distribution does not differ from that expected under normality (Shapiro–Wilk normality test: W = 0.989, p = 0.1001), with a skew = −0.18±1.048, and a kurtosis = 0.048 ± 0.443. The mean of this distribution occurs at 318.9 days after hatching and is represented by the black arrow.

