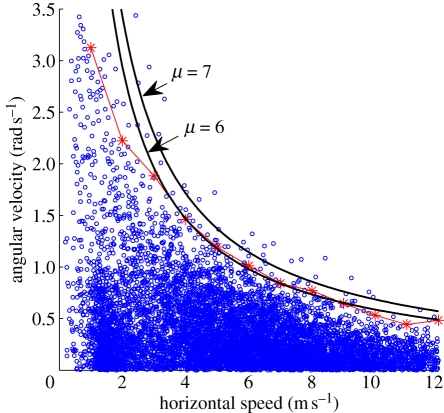
Figure 2.
Data from 17 horses turning during two competitive polo games. The red stars show 99% percentile of the angular velocity while grouping the data by horizontal speed with the bin width of 1 m s−1. Larger heading angular velocity occurred at low horizontal speed and the angular velocity was lower at higher horizontal speed. The black lines show the relationship between angular velocity and horizontal speed predicted by a friction limit/lateral force limit model with a static coefficient of friction of 0.6 and 0.7, respectively. The larger the static coefficient friction, the further the line is from the x-axis and y-axis.

