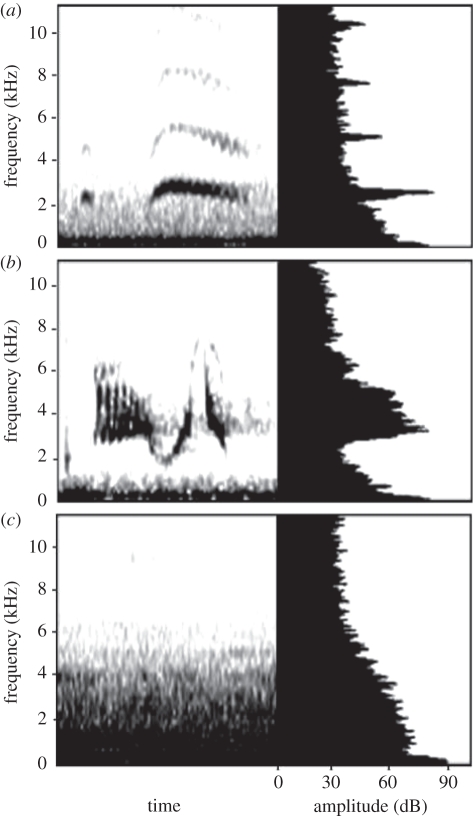
Figure 1.
Spectrograms (left) and power spectra (right) of (a) ash-throated and (b) grey flycatcher songs and (c) of background noise on a treatment site at 200 m from the compressor. Darker shades in spectrograms indicate more acoustic energy located at those frequencies, which is reflected by higher amplitude values in the power spectra. See figure S2 in the electronic supplementary material for an example of background noise at 50 m from the compressor.

