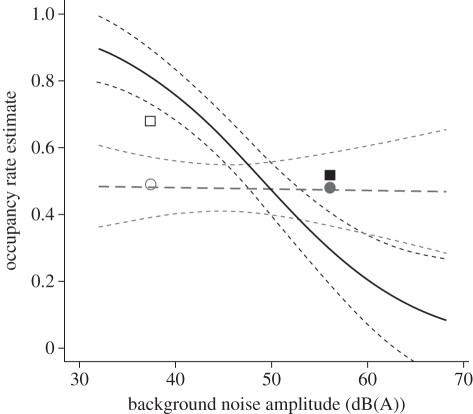
Figure 2.
The occupancy rate estimate for grey flycatchers declined significantly with increased noise amplitude at the point count locations (solid black line). Ash-throated flycatcher occupancy was not significantly affected by noise amplitude (bold grey long-dashed line). Small-dashed lines denote 95% confidence intervals for occupancy estimates with respect to noise amplitude. Points are located at the mean noise amplitude on each site-type and represent the proportion of point count locations where grey flycatchers (black square) and ash-throated flycatchers (grey circle) were detected on treatment sites (filled symbols) and control sites (open symbols).

