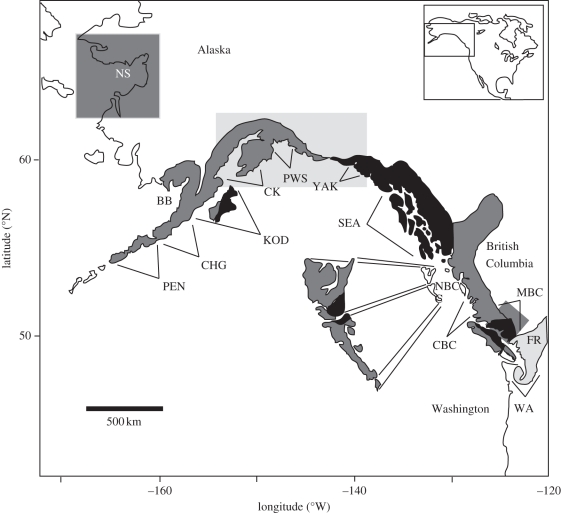
Figure 1.
Map of the study area. The shaded watershed regions are adapted from Ricker [12], which he identified as odd-year dominant with respect to abundance (light grey), even-year dominant (dark grey) and no dominance (black). The shaded grey rectangles show regions that were not covered in Ricker [12] but show even-year dominance (NS), areas that Ricker [12] considered even-year dominated and now appear to be odd-year dominated (CK, PWS, YAK), or now appear to be odd-year dominated (MBC). Regions and stocks in the database are Washington (WA, stocks 1–7), Fraser River (FR, stock 8), Mainland B.C. (MBC, stock 9), Central B.C. (CBC, stocks 10–12), Northern B.C. (NBC, stocks 13–14), Southeast Alaska (SEA, stocks 15–17), Yakutat (YAK, stocks 18–19), Prince William Sound (PWS, stocks 20–22), Lower Cook Inlet (CK, stocks 23–25), Kodiak Island (KOD, stocks 26–30), Chignik (CHG, stocks 31–35), Alaska Peninsula (PEN, stocks 36–38), Bristol Bay (BB, stock 39) and Norton Sound (NS, stocks 40–43). See the electronic supplementary material for stock identities and associated information.

