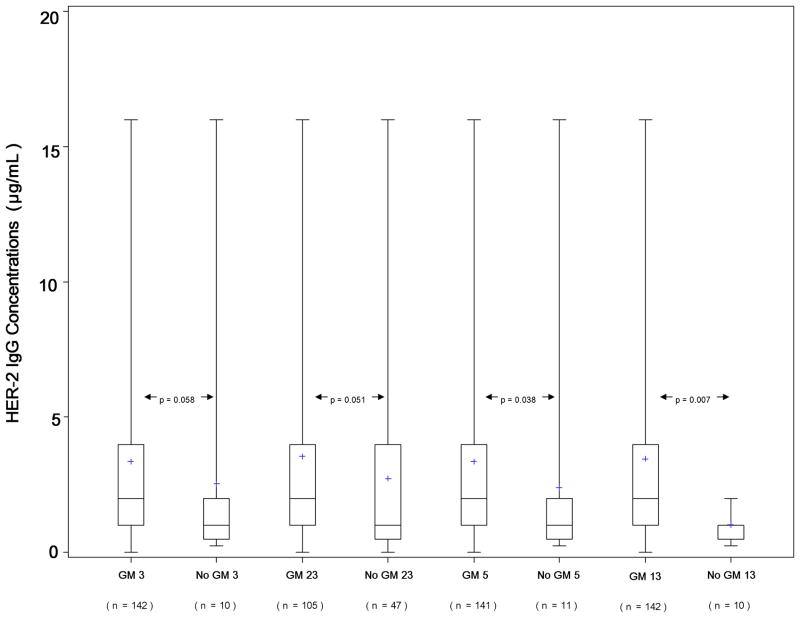
Fig. 2.
Boxplots of HER-2 IgG levels and GM 3, GM 23, GM 5, and GM 13 allotypes. Bold horizontal lines indicate the median IgG levels corresponding to the presence or absence of particular allotype, while boxes are indicative of the interquartile ranges. Dotted lines extend from the 5th to the 95th percentiles, and plus (+) signs indicate minima and maxima.

