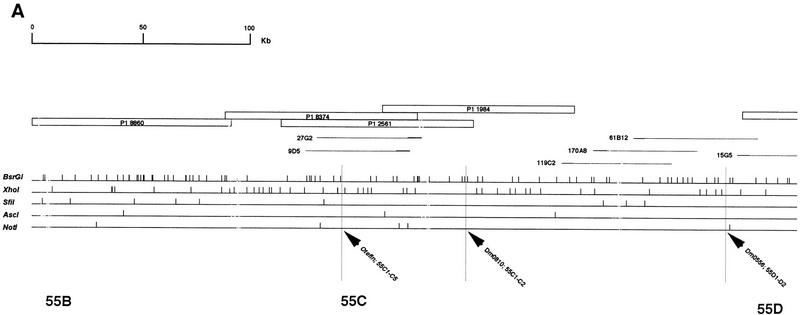
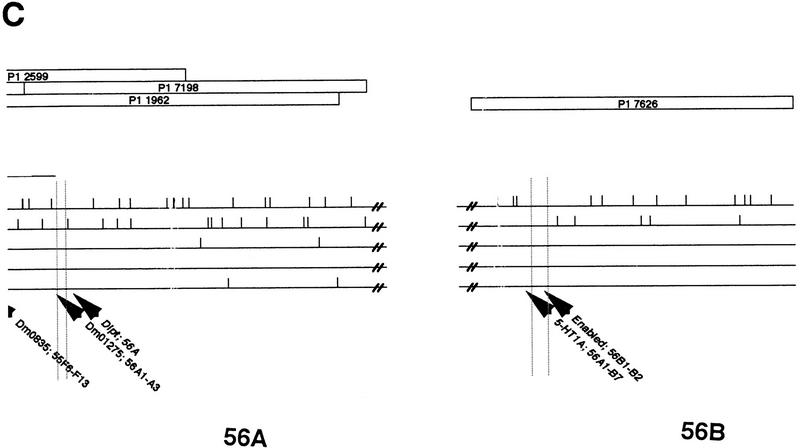
Figure 4.
Physical map of the 55B–56AB region of Drosophila melanogaster 2R chromosome. The contig of P1 and cosmid clones that were used in restriction mapping is represented at the top. Empty boxes correspond to P1 clones and thin lines correspond to cosmid clones. The thicker part of the lines represent the cosmid vector, Lorist 6. The restriction map of the region is given below the corresponding clones. Each horizontal line corresponds to a restriction enzyme and vertical traits indicate restriction sites. A total of 357 restriction sites were placed in the 55B–56A region. The precise localization of STSs and gene fragments on the restriction map is pointed out by high vertical traits. otefin and diptericin were found in the contig, whereas 5-HT1A and enabled probes hybridized on the 7626 P1 in 56B. The limits of the different parts of the contig (55B, 55C…) were estimated using BDGP data regarding clones and STS in situ localization. The 55E2–E6; 55F3 region which when deleted greatly impairs the resistant phenotype, is represented by shading. Its size is probably overestimated because of the inaccuracy of in situ localization of the clones and of the limits of the deletions.


