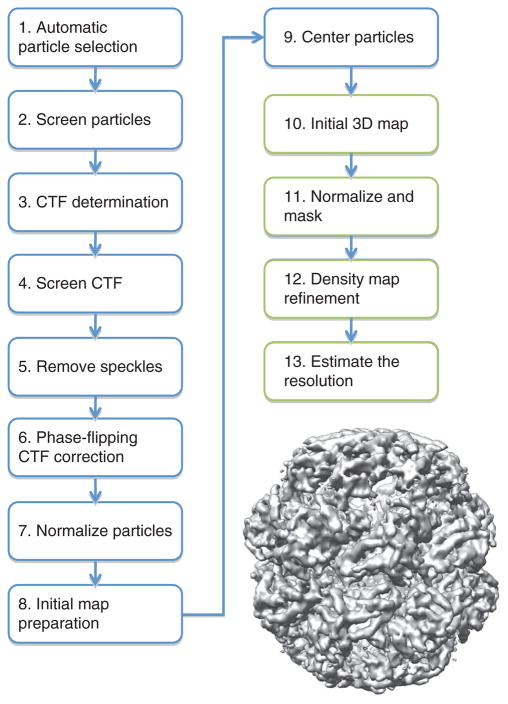
Figure 1.
The cryo-EM density map reconstruction process. An outline of the procedure used for the reconstruction of Mm-cpn is shown. Steps involving the 2D particle images are highlighted in blue, whereas steps involving the 3D density map are shown in green. The reconstruction at 4.3 Å resolution is shown on the right.

