
Figure 10.
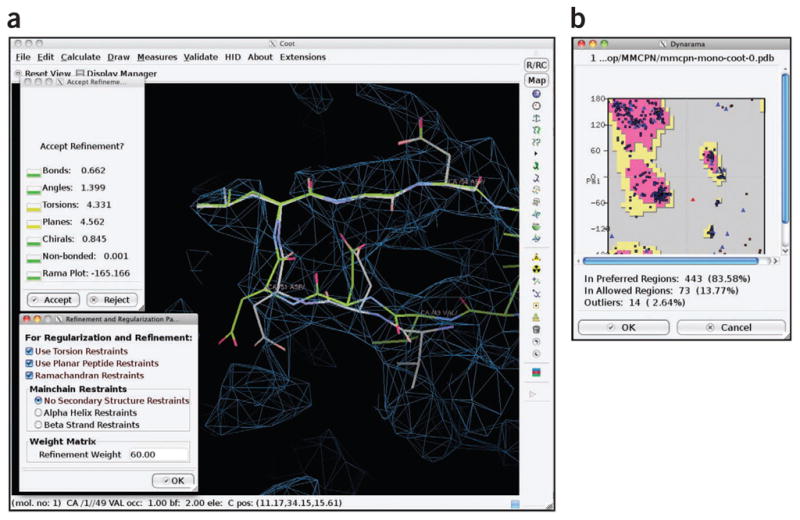
Optimization with Coot. Coot was used to adjust main chain and side chain atom positions to optimize the fit of the atomic model in the density map of Mm-cpn. Shown in a is a screenshot using the ‘Real Space Refine Zone’ tool in Coot, whereas b shows the corresponding Ramachandran plot.