
Figure 4.
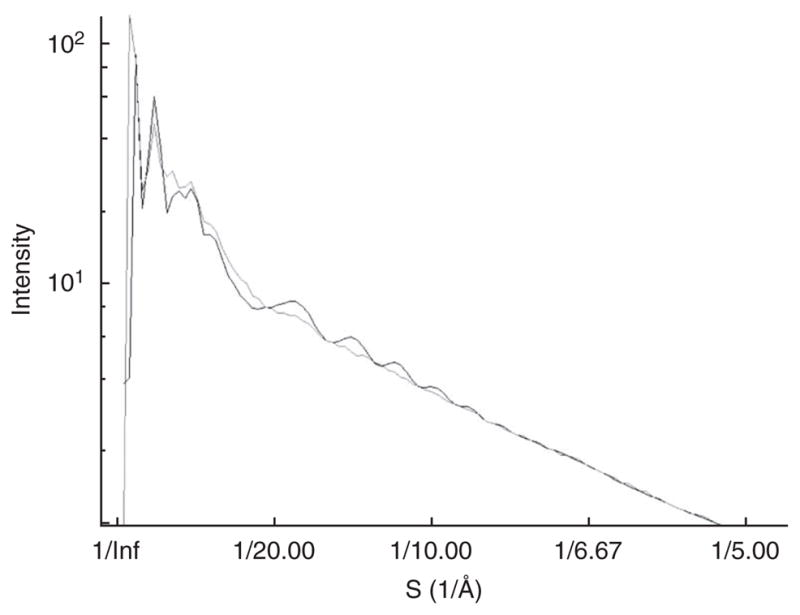
CTF curve. The experimental CTF curve, shown in gray, is plotted against the fit CTF curve (black) for particles from a typical CCD frame.
Official websites use .gov
A
.gov website belongs to an official
government organization in the United States.
Secure .gov websites use HTTPS
A lock (
) or https:// means you've safely
connected to the .gov website. Share sensitive
information only on official, secure websites.
CTF curve. The experimental CTF curve, shown in gray, is plotted against the fit CTF curve (black) for particles from a typical CCD frame.