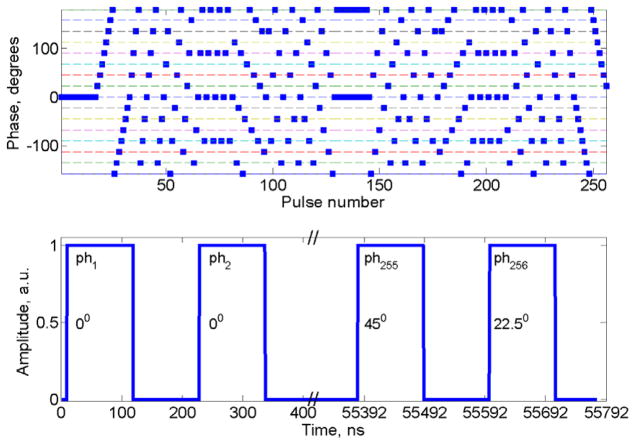
Figure 1.
The pulse sequence that was used to produce the spectra in Figure 2 consisted of 256 pulses of 109 ns with the 16 different phases selected as shown in part a. The time required for the complete sequence was about 56 μs. The detailed timing of the first 2 and last 2 pulses is shown in part b. Data were acquired continuously at 4 ns intervals during the entire pulse sequence, but only the signal corresponding to times between the pulses was analyzed.

