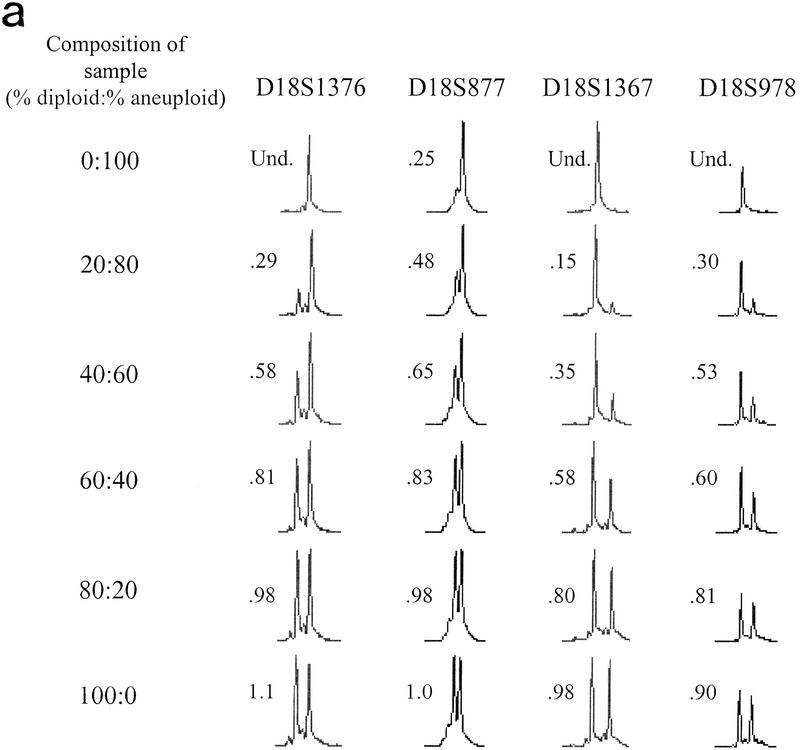
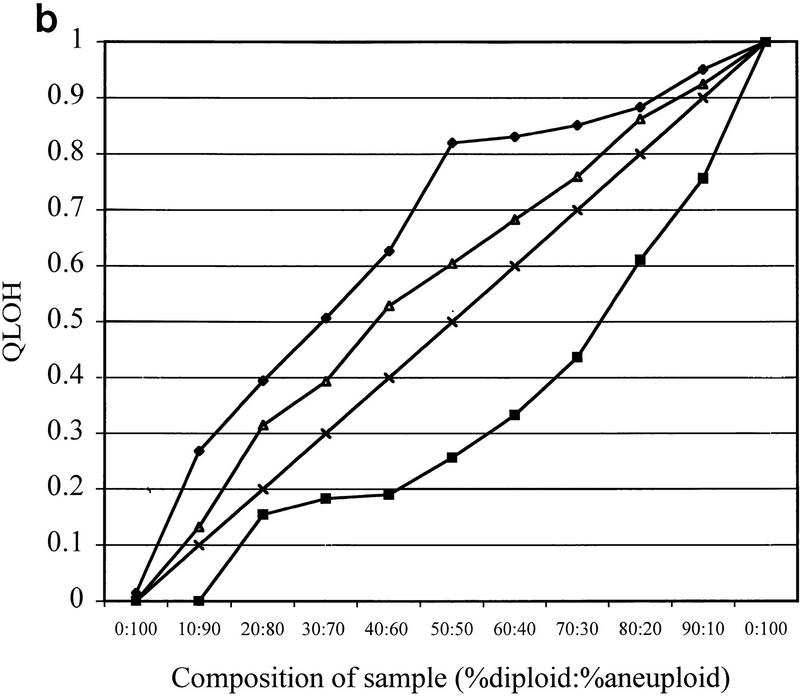
Figure 4.
LOH detection in the presence of normal cell contamination. Two DNA samples, one corresponding to a biopsy sample with no allelic loss on chromosome 18 (diploid), the other corresponding to a biopsy sample that had undergone chromosome 18 nondisjunction (aneuploid), underwent PEP reactions with genomic input DNA from 1000 cells. Pooled PEP reactions were mixed in the ratios indicated and subjected to locus-specific PCR. (a) Electropherograms showing allele ratios in diploid/aneuploid mixtures for four chromosome 18 STRs. Numbers indicate allele ratios. The reciprocal of the allele ratio was taken for those STRs that had ratios >1 (i.e., larger allele was lost), for ease of comparison. (b) Variable STR sensitivity for LOH detection. QLOH for each sample was determined by dividing the allele ratio obtained for each DNA mixture by the allele ratio of the all-diploid sample. The STRs that were most sensitive (shaded squares) and least sensitive (solid diamonds) in detecting a minority population of cells with LOH correspond to the upper (D18S1369) and lower (D18S541) plots, respectively. The average plot (triangles) represents the numerical average of QLOH for all 14 informative markers; the expected plot (line) represents a theoretical line assuming the allele intensity is exactly proportional to its abundance in a population. QLOH was corrected for the contribution of stutter for samples in which the lost allele was in the stutter position.


