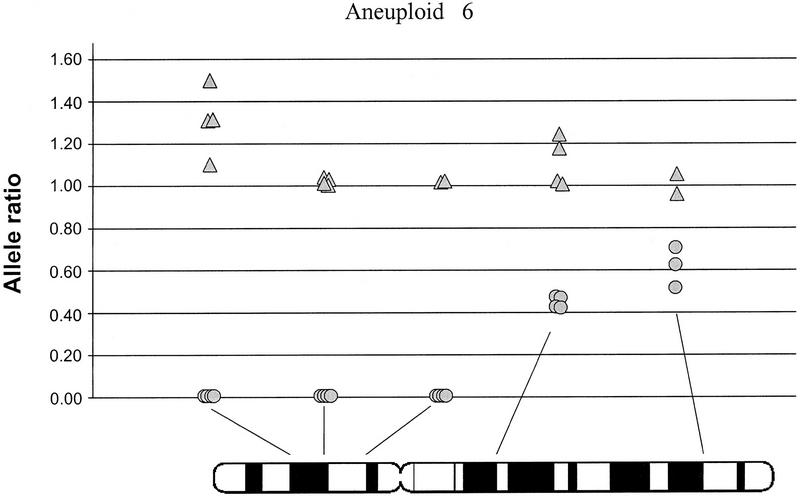
Figure 6.
Allele ratios within a single aneuploid population. Allele ratios are shown for normal (triangles) and aneuploid (circles) populations from aneuploid 6. Results from the replicate samples are shown for the five informative loci on chromosome 9. PCR failure resulted in fewer than four replicates at three loci.

