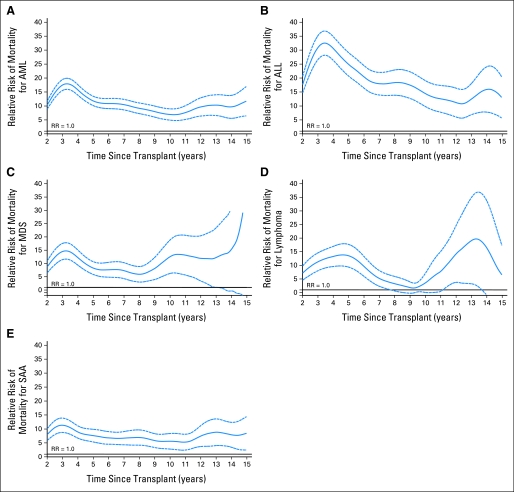
Fig 2.
(A) Relative mortality curves for patients with acute myelogenous leukemia (AML) receiving myeloablative allogeneic transplants surviving at least 2 years in remission post transplantation. (B) Relative mortality curves for patients with acute lymphoblastic leukemia (ALL) receiving myeloablative allogeneic transplants surviving at least 2 years in remission post transplantation. (C) Relative mortality curves for patients with myelodysplastic syndrome (MDS) receiving myeloablative allogeneic transplants surviving at least 2 years in remission post transplantation. (D) Relative mortality curves for patients with lymphoma receiving myeloablative allogeneic transplants surviving at least 2 years in remission post transplantation. (E) Relative mortality curves for patients with severe aplastic anemia (SAA) receiving myeloablative allogeneic transplants surviving at least 2 years in remission post transplantation.

