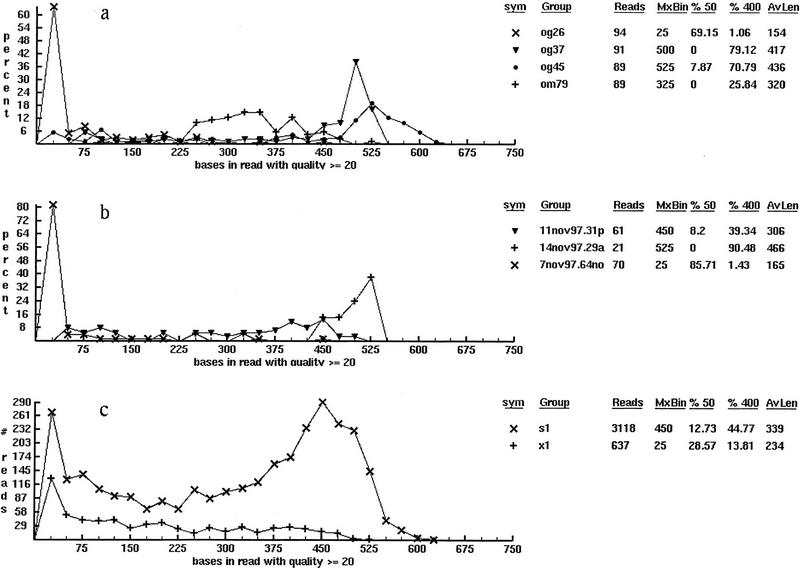
Figure 5.
Typical classifications of base quality statistics for a sequencing project: (a) by plate name, (b) by gel name, and (c) by reaction chemistry. Each frame is imported directly from the viewer shown in Fig. 3 and is unretouched with the exception of adding a label to indicate the classification being displayed. (Such labels are not used in the software because an arbitrary mixing of groups is permitted on a single display.) The first and second columns in the legend show the symbol used to identify each function and the function name. In a function names are plates; in b and c they are gel names and read types. (s1) Current dye-primer and (x1) dye-terminator read-type chemistries. The next two columns show the number of DNA fragment reads in each function and the location on the abscissa at which the function maxima occur. The columns give the percentage of reads in each function having 50 (%50) or fewer good bases and 400 (%400) or more good bases and the remaining column is the average read length for each function.

