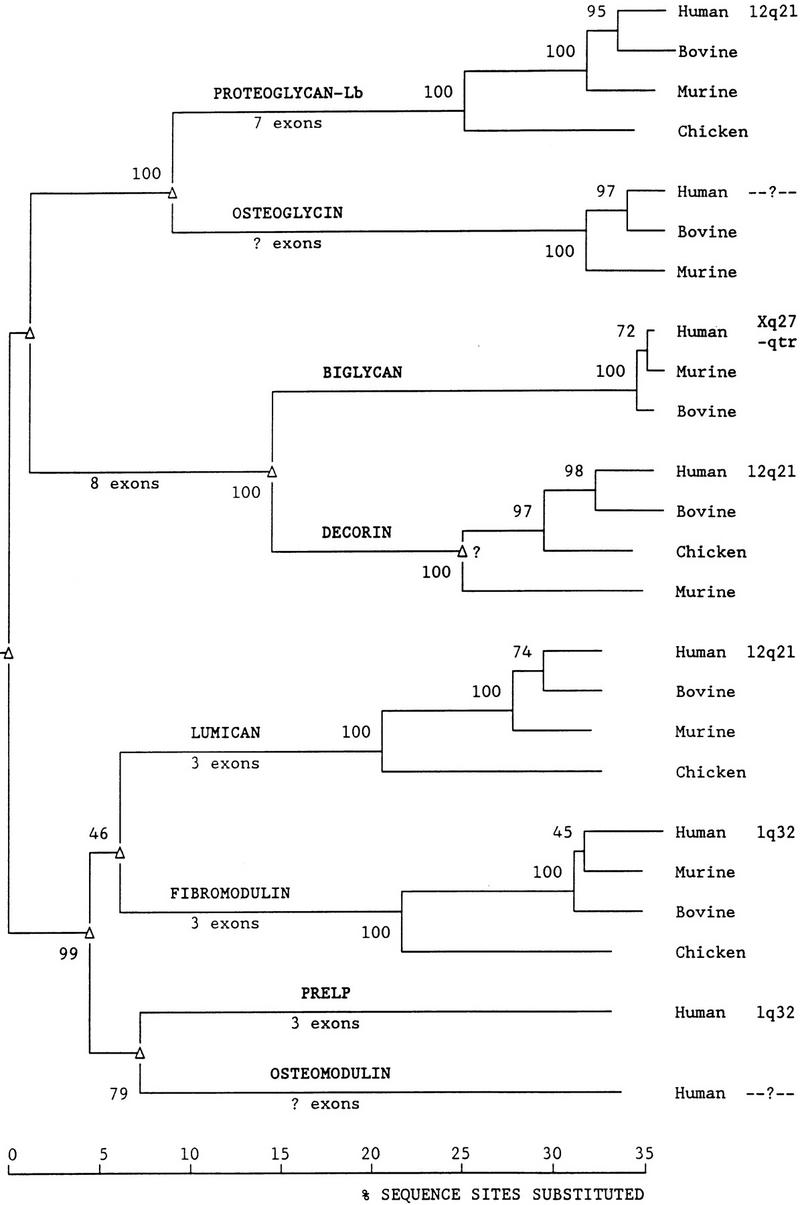
Figure 3.

Phylogenetic tree of the SLRP gene family and related genes. (▵) Gene duplication. Numbers on branches (at left of node) represent the percent bootstrap replicates supporting that node. Chromosomal location of the human genes is shown. Branches are to scale and represent percent amino acid sequence sites substituted. No correction for undetected multiple replacements at a site was made in the tree shown. Root of the tree is arbitrarily placed.
