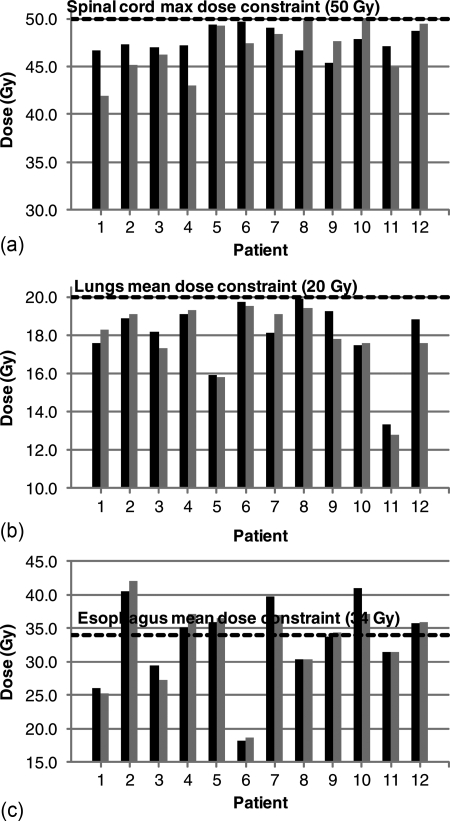
Figure 6.
Comparison of ROCO and treatment planner plans. Black bars show doses to organs for ROCO plans, and gray bars show the doses for the planner’s plans. ROCO plans are normalized to have the same D95 as the planner’s plan for each patient. The black dashed lines indicate the relevant clinical constraint. ROCO plans satisfy the same clinical constraints as the planner’s plan in all cases.

