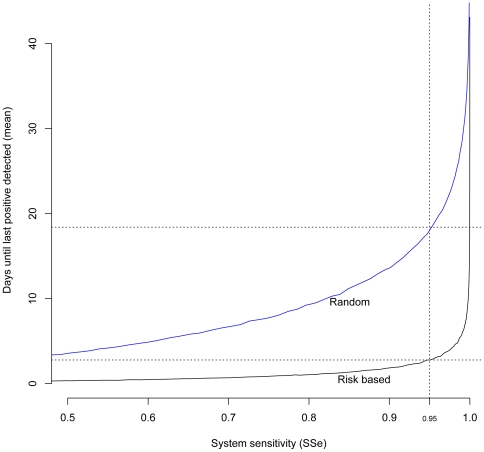
Figure 4. Timing benefits of risk-targeted and ordered sampling.
Expected time to last positive farm for randomly selected/ordered (blue) and risk-targeted and ordered sampling (black) shown plotted against system sensitivity (SSe). This analysis assumes that 50 farms are sampled and tested per day.

