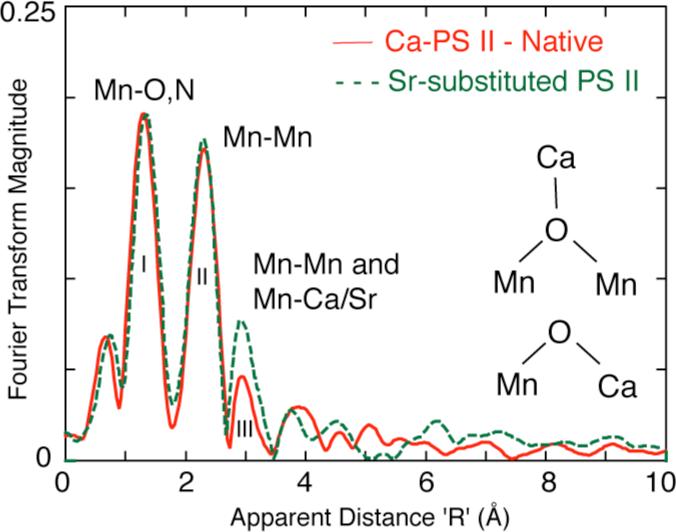
Figure 1.
Three major Fourier peaks are seen in the Mn EXAFS of Ca and Sr containing PS II samples [15]. The first peak is assigned to Mn-O,N ligands. The second FT peak is assigned to Mn-Mn distances. A third FT peak fits best to Mn-Mn and Mn-Ca/Sr distances The spectra are clearly different in the amplitude of the third peak, which isenhanced in the spectrum from the Sr-reactivated sample, as this peak consists of both Mn-Mn and Mn-Ca or Sr contributions. The insets shows the Ca oxo-bridging motifs to Mn that are compatible with the Mn-Ca and Mn-Sr distances of 3.3 and 3.4 Å respectively.

