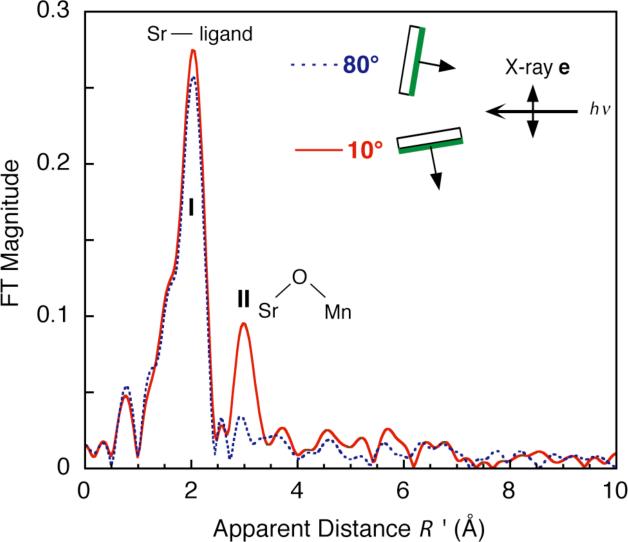
Figure 3.
Fourier transform of Sr EXAFS from oriented Sr-PS II samples at two angles (θ). The dichroism is most readily apparent in Fourier peak II (R’ = 3.0 Å), where the amplitude is largest at 10° (solid line), and smallest at 80° (dashed line). The inset shows the layered PS II membranes and the underlying substrate in relation to the X-ray e-vector, which is perpendicular to the direction of propagation of X-rays. Fourier peak I is backscattering from O and peak II is backscattering from Mn.

