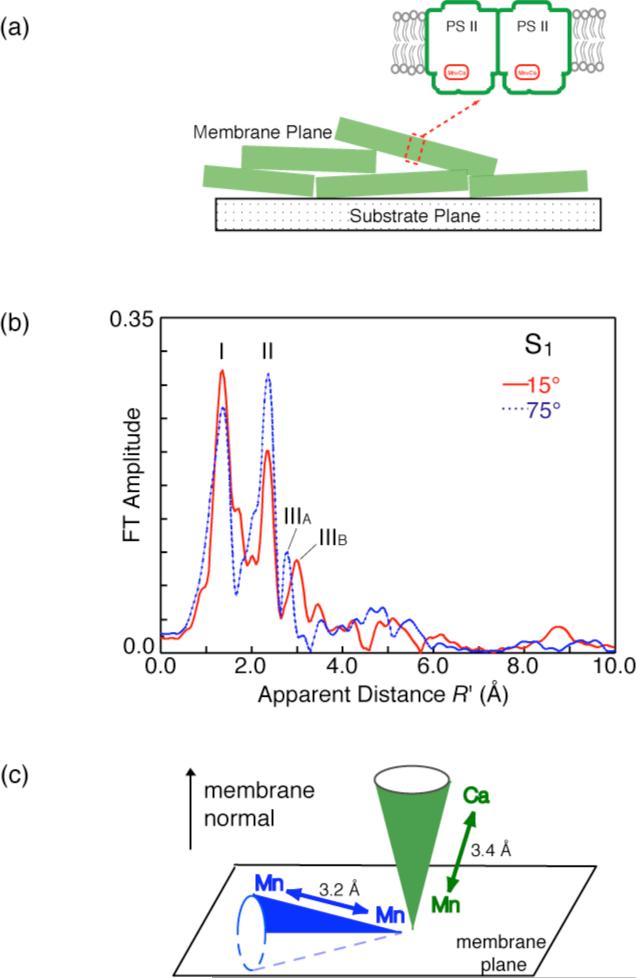
Figure 4.
a) Schematic of PS II membranes showing the orientation of the membrane plane.
b) Fourier Transform (FT) of Mn K-edge EXAFS spectra from oriented PS II membrane samples in the S1 state obtained with a high-resolution spectrometer (range-extended EXAFS). Angles indicate orientation of the membrane normal with respect to the X-ray e-field vector. FT peak IIIA and IIIB are from Mn-Mn and Mn-Ca vectors.
c) The orientation of the average Mn-Ca (~3.4 Å) and the Mn-Mn (~3.2 Å) vectors relative to the membrane normal.

