
Figure 3.
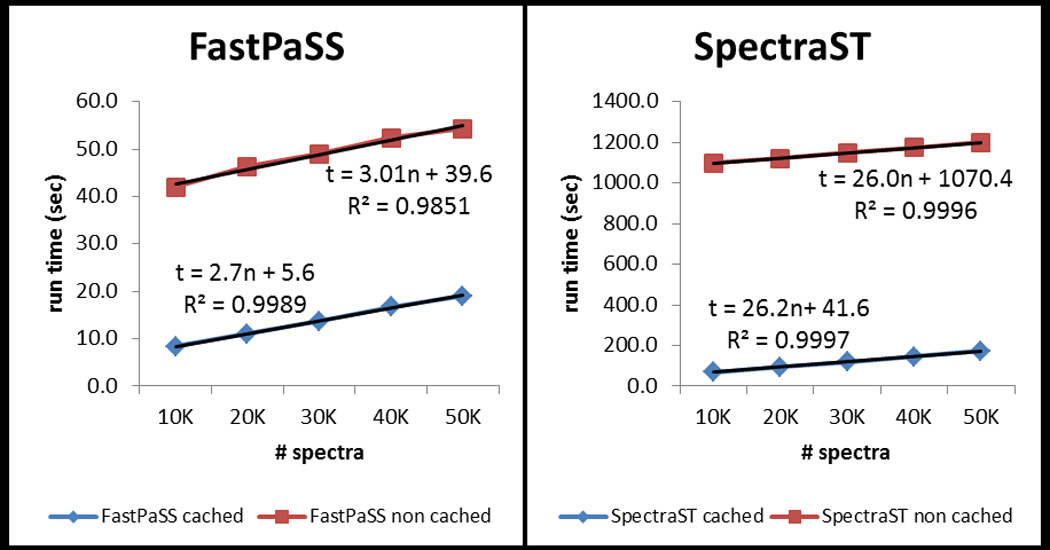
Plot of FastPaSS (Tesla GPU) and SpectraST cached and un-cached run times. In the equations representing the regression lines, “n” is the number of queries and “t” is the runtime in seconds.
Official websites use .gov
A
.gov website belongs to an official
government organization in the United States.
Secure .gov websites use HTTPS
A lock (
) or https:// means you've safely
connected to the .gov website. Share sensitive
information only on official, secure websites.
Plot of FastPaSS (Tesla GPU) and SpectraST cached and un-cached run times. In the equations representing the regression lines, “n” is the number of queries and “t” is the runtime in seconds.