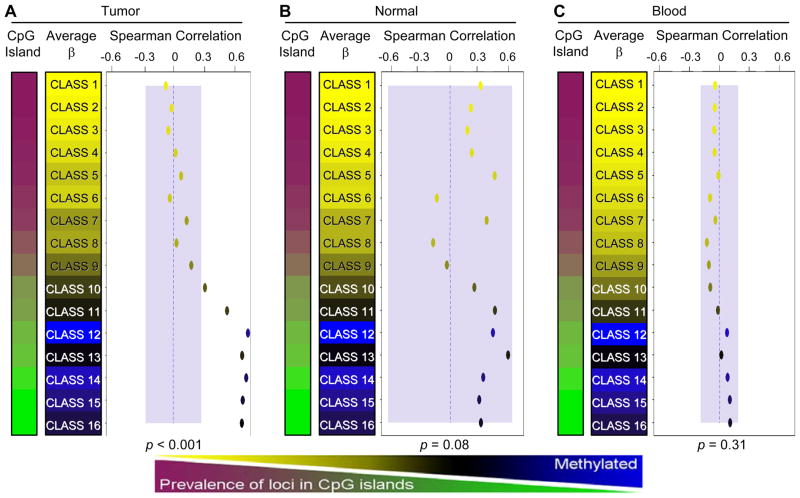
Figure 3.
Classes of array CpG loci are associated with global methylation levels in tumors but not in normal tissues. RPMM is used to cluster loci with similar methylation β values into sixteen methylation classes. Spearman’s correlation coefficients are calculated by comparing the mean methylation of class member loci for each sample to LINE-1 methylation level and plotted by class. Correlation points are colored according to their mean class methylation (as indicated in the color sidebars). Classes were ordered according to the percentage of their member loci mapping to CpG island regions. A separate RPMM model was applied to the data for each tissue type: (A) HNSCCs, (B) non-diseased head and neck tissues, and (C) normal peripheral blood. Blue shaded regions represent the 95% confidence limits of the observed maximums correlation from 10,000 random permutations (representing the null distribution). Therefore, correlations lying outside of these regions are considered statistically significant. Permutation test omnibus p-values are displayed at the bottom of each panel. Dotted blue lines indicate the zero correlation axis.

