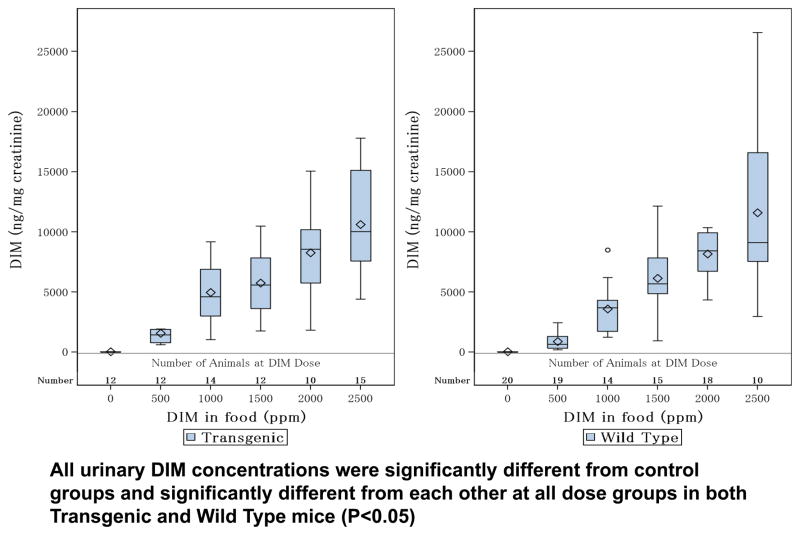
Figure 3. Concentrations of DIM in Transgenic and Wild type Mice From Each Dose Groupg.
Box plots of DIM Levels at each DIM dose in transgenic and wild type mice. Jonckheere-Terpstra trend test result: both type reported significant trends (P<0.0001). Modified Mann-Whitney test was used to significant effect of each DIM dose cumulatively. Both transgenic and wild type reported significant dose effect (P<0.05) at consecutive DIM treated groups.

