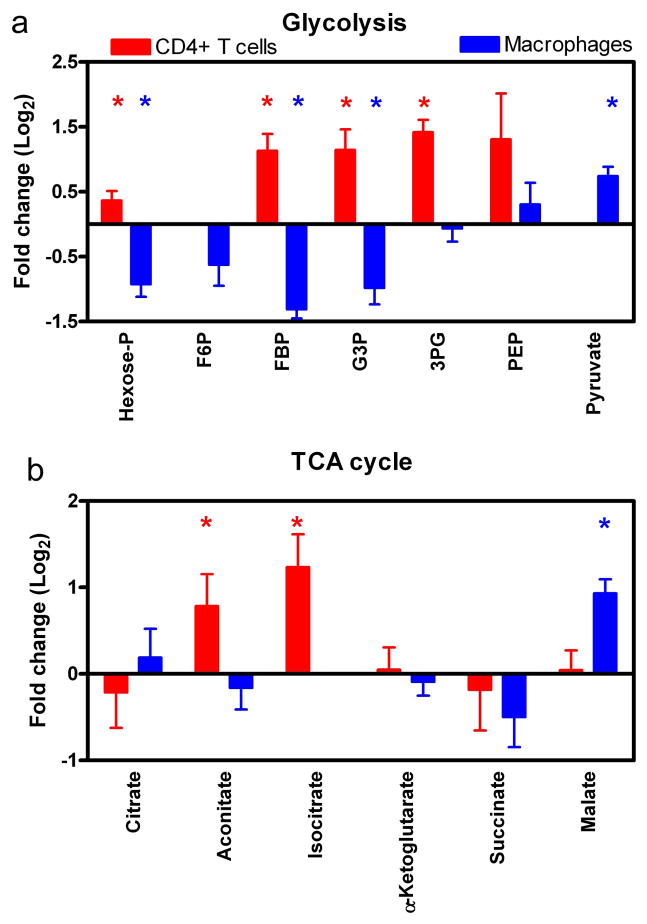
Figure 3.
LC-MS/MS analysis of glycolysis and TCA cycle metabolic pools. A) LC-MS/MS analysis of glycolytic intermediates for CD4+ T cells (red) and macrophages (blue) are shown as fold change in data. Metabolites that have a significant difference are denoted with asterisks. B) TCA cycle intermediate pool sizes are compared as described above. For CD4+ T cells, the ratio of GFP+/GFP− metabolite intensities were compared, whereas the ratio of U1/U937 metabolite intensities are shown for macrophages. Significant differences were determined using paired T-test. For CD4+ T cells, four independent donors were done in duplicate (n=8). Seven LC-MS/MS runs were compared for U1 and U937 cells. Data displayed as Log2 converted and SEM.

