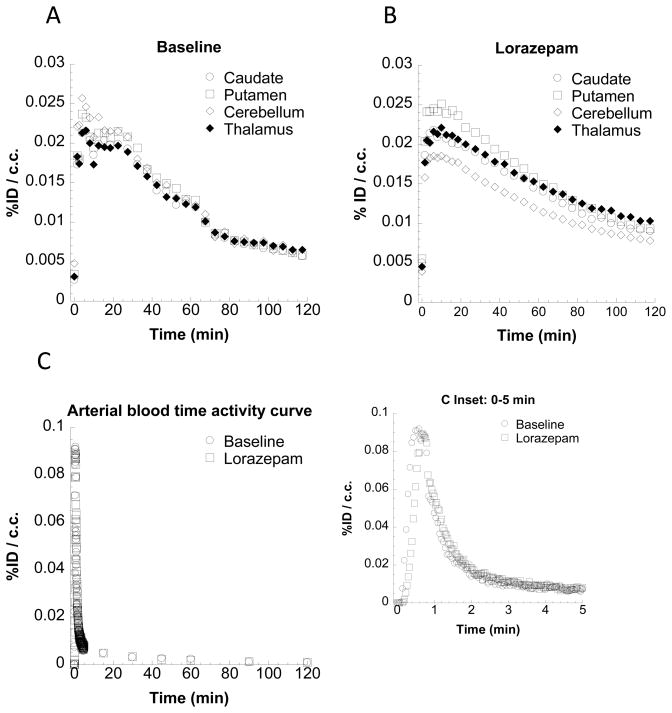
Figure 4.
Blood and Tissue time-activity curves (TACs) of [18F]5 in from microPET imaging studies.. A and B show regional brain TACs from baseline and lorazepam studies. The uptake of [18F]5 in the representative monkey brain regions (caudate, putamen, cerebellum, and thalamus) reached peak accumulation in the caudate and putamen 5 min post-i.v. injection. Lorazepam (1 mg/kg/i.v.) treatment increased [18F]5 uptake in the caudate, putamen and thalamus. C shows that lorazepam treatment did not change the arterial blood TAC compared to baseline data. The inset graph shows that there was also no change during the initial 5 minutes.

