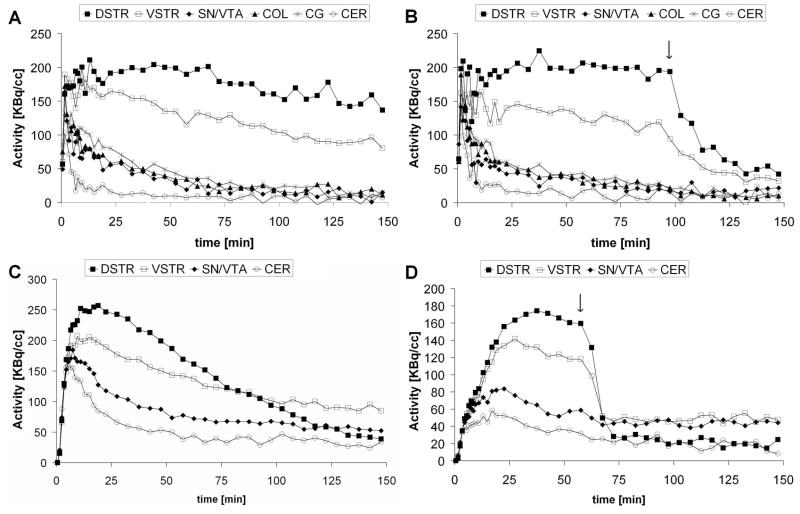
Figure 2.
Representative TACs from the baseline (A,C) and the haloperidol blockade (B,D) PET scans with both [18F]fallypride (top) and [18F]DMFP (bottom). Curves from dorsal striatum (DSTR), ventral striatum (VSTR), colliculi (COL), substantia nigra/ventral tegmental area (SN/VTA), central gray (CG) and cerebellum (CER) are shown. Arrows in panels B and D indicate the time of haloperidol administration.

