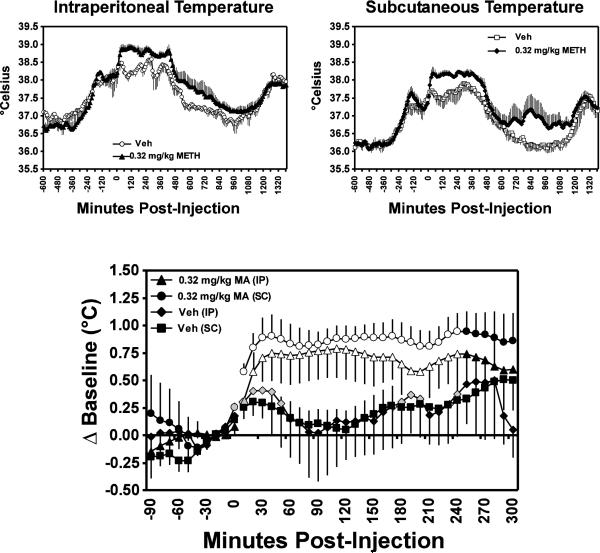
Figure 3.
Mean (N=4; bars indicate SEM) IP and SC body temperatures are presented for days in which animals were challenged with vehicle or 0.32 mg/kg methamphetamine (i.m.). The upper panels show raw temperatures at 10 min intervals across the entire day of challenge. The lower panel depicts 10 min samples in the hours immediately surrounding the injection, with temperature responses represented as a change from the average of the three pre-injection samples. Open symbols represent points which are significantly different from both the baseline timepoint and the respective vehicle timepoint relative to injection. Shaded symbols represent a significant difference from the pre-injection baseline (only) and the * indicates points in the drug conditions which differ significantly from the respective vehicle timepoint (only).

