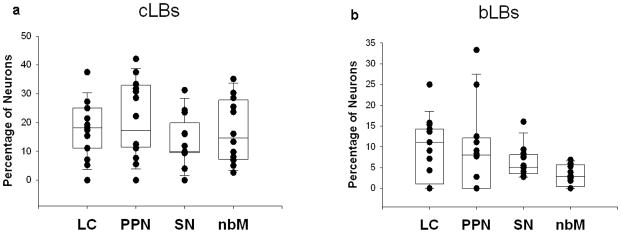
Fig. 4.
Box plots of percentage of neurons with cortical- (a, cLBs) or brainstem- type LBs (b, bLBs) in LC, PPN, SN and nbM. All counts were done on 5 μm paraffin sections double labeled for α-synuclein and either ChAT or TH. (Boxes show median, 25th and 75th percentile; whisker plots show 5th and 95th percentile.)

