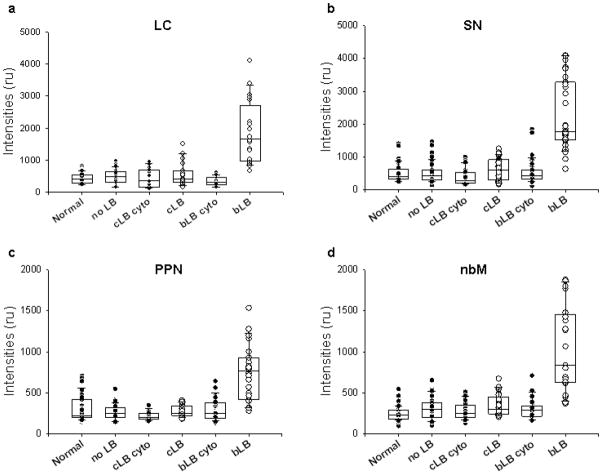
Fig. 5.
Box plots of median signal intensities in relative units (ru) of TH (a, b) and ChAT (c, d) in the LC (a), SN (b), PPN (c) and nbM (d) in cytoplasm (cyto) (black dots) and in LBs (white dots) in cells with cortical-type LBs (cLB), brainstem-type LBs (bLB) and no LBs, as well as the cytoplasm of neurons in normal controls (normal). See Table 2 for statistical comparisons. (Boxes show median, 25th and 75th percentile; whisker plots show 5th and 95th percentile.)

