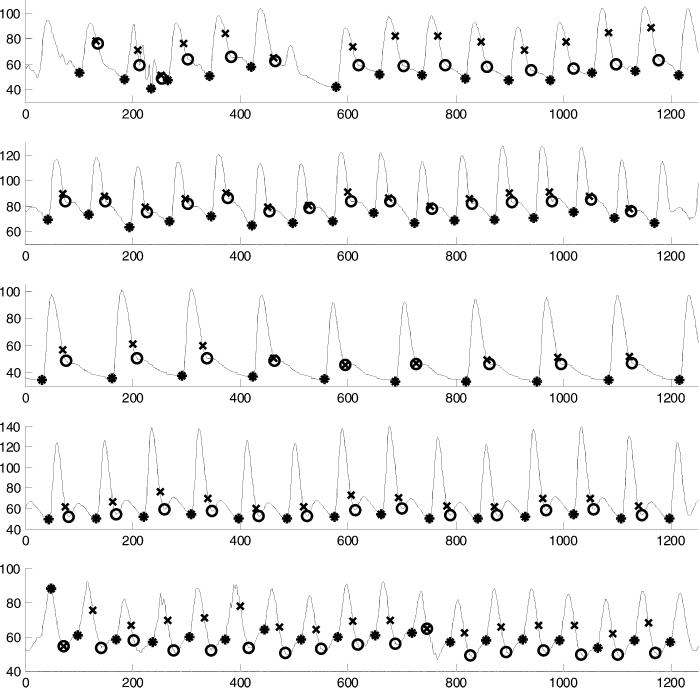
Figure 1.
Five examples of arterial blood pressure waveforms and their key features as identified by our automated algorithms. The horizontal axis is sample number, with 125 samples = one second. Onset point of each beat is indicated by an asterisk “*”; end of systole, estimated by 0.3 · √beat_period, is indicated by “X”; end of systole, estimated by the ‘lowest nonnegative slope’ method, is indicated by a “0”.

