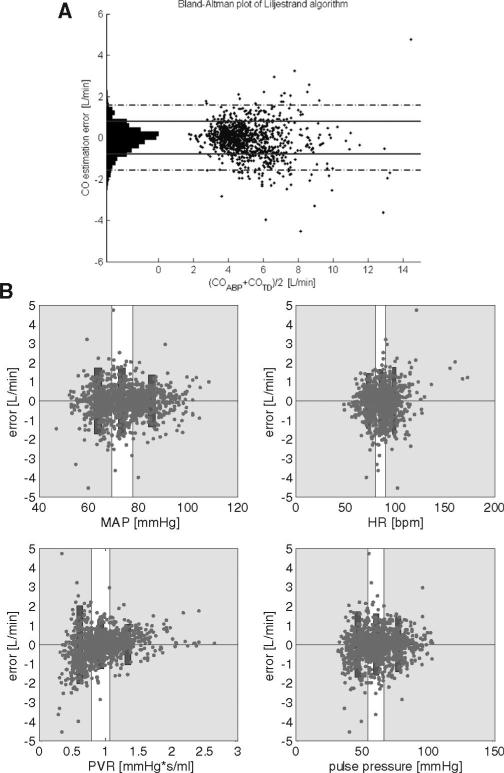
Figure 3.
A, Bland-Altman plot comparing cardiac output (CO) estimated by the algorithm (Liljestrand, using the C1 calibration methodology) with CO thermadilution (COTD). 95% limits-of-agreement for this algorithm and the other investigational algorithm are summarized in Table 3. B, Liljestrand algorithm estimation error as a function of several variables. Bins of equal sample sizes are illustrated. Rectangular bars represent 95% limits-of-agreement for each bin. For example, as shown, CO estimation error decreases as peripheral vascular resistance (PVR) increases. MAP, mean arterial pressure; HR, heart rate.

