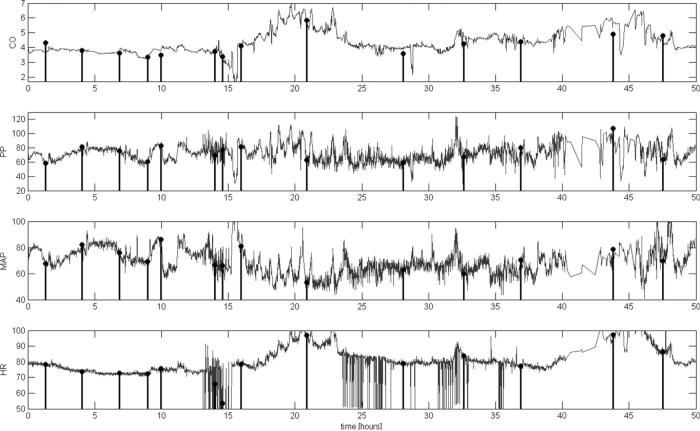
Figure 4.
Example of continuous cardiac output (CO)-from-arterial blood pressure (ABP) estimated by the Liljestrand algorithm (gray line) versus episodic thermodilution CO measurements (stem plots) for a subject over a 50-hr time interval, using a single calibration factor (C1, see text for details). Pulse pressure (PP), mean arterial pressure (MAP) and heart rate (HR) through this same temporal window, as computed by our algorithm, are also shown (gray lines) with stem plots illustrating their values each time CO thermadilution (COTD) was measured. C1 calibration minimizes the root-mean-square of the difference of each pairing of COTD and the corresponding CO-from-ABP estimations. C2 calibration uses the first pairing of the CO-from-ABP estimate and COTD only. For each investigational algorithm, the distribution of errors versus COTD was compared with the distribution of errors of ‘calibrated MAP’ using the Kolmogorov-Smirnov test. *Significantly different from calibrated MAP (p < 0.001) per McNemar's test. #When using the alternative “lowest nonnegative slope” method to estimate the systolic interval, the lower/upper limits are –1.94/+1.54 L/min. Results in Table 3 employ 0.3 ·√beat_period to estimate systolic interval. ##When using the alternative “lowest nonnegative slope” method to estimate the systolic interval, the lower/upper limits are –2.40/+1.97 L/min.

