
Figure 4. Effect of TGFβ1 knock down on the growth and in vitro tumorigenicity of PacMetUT1 cells.
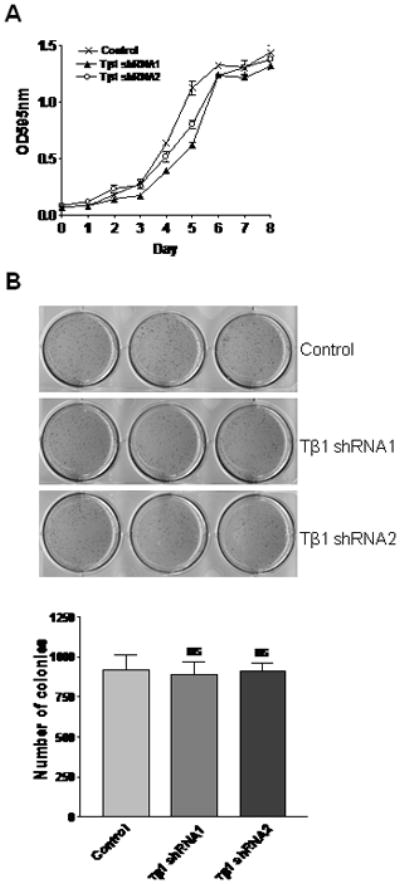
(A) Growth of control and TGFβ1 knock down PacMetUT1 cells was measured with MTT assay at an absorbance of 595 nm after every consecutive day for 8 days. Data presented are mean ± SEM from triplicate measurements. (B) Anchorage-independent growth by TGFβ1 knockdown PacMetUT1 cells was compared to control cells after 10 days of growth in soft agar. Figures presented are triplicates for each cell line. The number of colonies were counted and is presented as mean ± SEM from triplicate wells. “ns” denotes no significant difference with a one-way ANOVA analysis.