
Figure 7. Decrease in osteoblastic bone lesions with the systemic administration of TGFβ inhibitors in vivo.
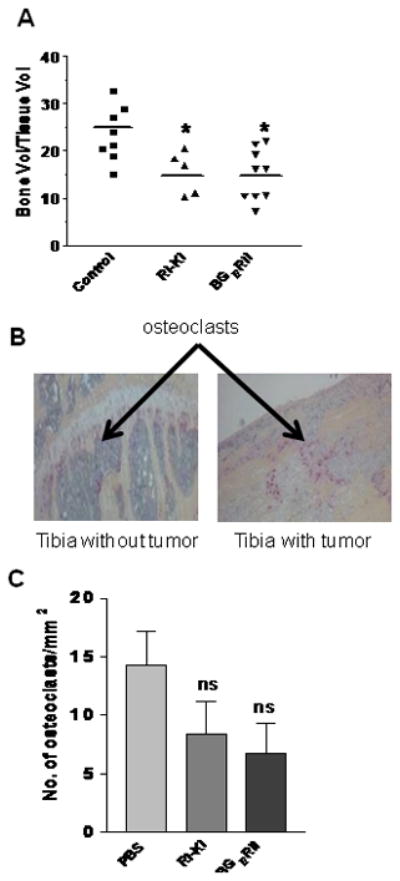
(A) Bone volume to total tissue volume in tibia sections was quantified in control, TβRI-KI, and BGERII treatment groups using BIOQUANT analysis software. The line represents average value of bone volume to total tissue volume in the each group. Asterisk “*” indicates statistically significant difference among the control, TβRI-KI, and BGERII inhibitor treatment groups with one-way ANOVA followed with Tukey’s post-hoc test at P<0.01. (B) After the termination of experiment at seven weeks, bone sections from tibias without (injected with PBS) or with PacMetUT1 cell-formed tumors were stained for osteoclasts using TRAP assay. Representative TRAP stained bone sections showing presence of the stained osteoclasts are presented. (C) The TRAP-stained osteoclasts below the growth plate were counted in the sections of the tibias containing tumors from the three groups of mice treated with PBS, TβRI- KI, or BGERII. Data presented are mean ± SEM from all tibias with tumors in each group (8 from control, 5 from RI-KI group, and 9 from BGERII group). “ns” denotes no significant difference.