Fig. 3.

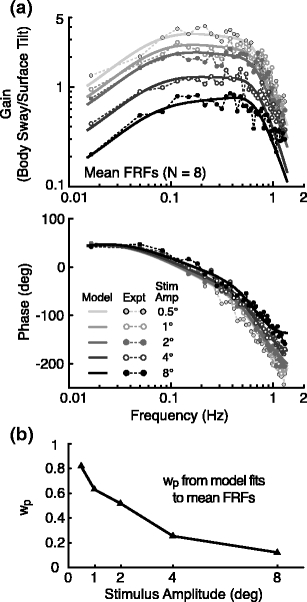
Results of the Stage 1 analysis. (a) Gain (upper graph) and phase (lower) of the mean experimental frequency response functions, FRFs, (points connected by dotted lines) and model fitted transfer functions (solid lines) of surface tilt to body sway for the five different stimulus amplitudes. The proprioceptive weight parameters, w p, were allowed to vary over experimental conditions. Graviceptive weights, w g, also varied but were linked to w p values such that w g = 1-w p. The model-fitted parameters that were constant over the five stimulus amplitudes were joint stiffness (k i = 40.5 Nm/rad) and damping (b i = 68.8 Nms/rad), the neural controller proportional (k p = 943.9 Nm/rad) and derivative (k d = 313.5 Nms/rad) gains, the lumped neural time delay (τ d = 0.097 s), and the gain (k t = 0.0018 rad/Nm) and time constant (τ t = 17.4 s) of the low-pass filter of the torque feedback loop. (b) The model-fitted proprioceptive weights decreased with increasing stimulus amplitude and accounted for the systematic decrease in gain with increasing stimulus amplitude
