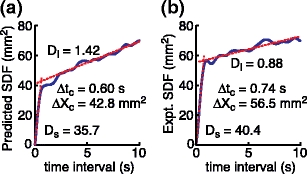
Fig. 8.

Results of the Stage 5 analysis. Shown are the stabilogram diffusion functions, SDFs, and their diffusion coefficients (short term, D s, and long term, D l) derived from linear fits (dotted lines) to the SDFs, and critical coordinates (critical time, Δt c, and displacement, ΔX c) determined by the intersection of both linear fits. The model-predicted SDF (a) was close to the experimentally estimated SDF derived from eyes-closed, quiet stance data of the same subjects (b)
