
Fig. 11.
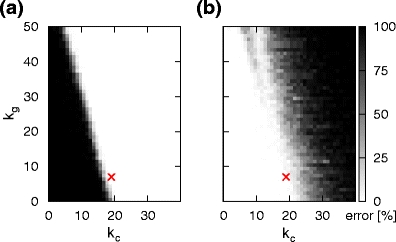
Switching errors as a function of the number of inhibitory cross connections k c (horizontal axis) and the number of global inhibitory connections k g (vertical axis). (a) Percentage of trials resulting in the activation of both successor chains (b) Percentage of trials resulting in the activation of neither of the successor chains. In both plots the red cross indicates the chosen parameter set k c = 19 and k g = 7