
Fig. 12.
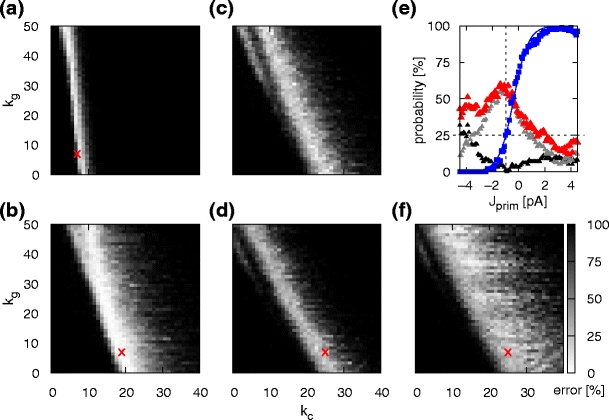
Total probability of switching errors as a function of the number of successor chains. (a) Total probability of switching error for two potential successor chains assuming structured cross-inhibition as a function of the number of inhibitory cross connections k c and number of global inhibitory connections k g. The plot shows the summed probabilities of Fig. 8(a) (probability of activating more than one successor chain) and Fig. 8(b) (probability of activating no successor chain). The red cross marks the parameter set k c = k g = 7. (b) As for (a) for the case of unstructured cross-inhibition; the red cross marks the parameter set k c = 19 and k g = 7. (c) As for (b) but for three potential successor chains. (d) As for (b) but for four potential successor chains; the red cross marks k c = 25 and k g = 7. (e) Conditional probability of switching to chain 2 as a function of the priming strength J prim for k c = 25 and k g = 7 (blue squares; sigmoidal fit to the data, blue curve). Probability of activating no successor chains (grey triangles), probability of activating multiple successor chains (black triangles) and total switching errors (red triangles). Dotted lines indicate chance level, i.e. a 25% probability of activating chain 2. (f) As for (d) but with excitatory priming J prim = 3 pA to chain 2