
Fig. 14.
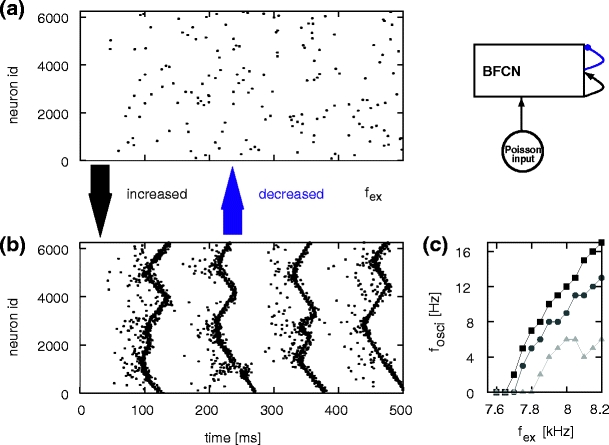
Activity state transition in the BFCN with global inhibition, network set-up top right. (a) Spiking activity in the BFCN plotted with an external excitatory Poissonian input of f
ex = 7.65 kHz to each neuron and  . Activity of 10% of the neurons is shown. (b) As in (a) but for f
ex = 7.9 kHz (c) Oscillation frequency of synfire waves as a function of the rate of the external Poisson input for different values of global inhibition:
. Activity of 10% of the neurons is shown. (b) As in (a) but for f
ex = 7.9 kHz (c) Oscillation frequency of synfire waves as a function of the rate of the external Poisson input for different values of global inhibition:  (black squares),
  (dark gray disks),
  (light gray triangles)