
Fig. 16.
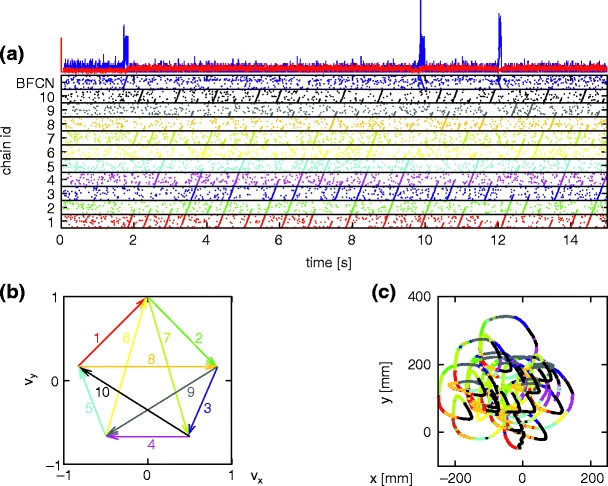
Generation of scribbling trajectories. (a) Spiking activity of BFCN and SFCN. Activity of 1% of the neurons is shown. The activity of each synfire chain is plotted in a strip marked by horizontal lines in the color of the corresponding arrow in velocity space shown in (b). BFC activity (blue) is plotted in the top strip. Above the raster plot the average firing rate of the SFCN (red) and the BFCN (blue) is plotted. (b) Reproduction of Fig. 4 for ease of reference. (c) Scribbling trajectory extracted from the spiking activity using population coding. Segments are drawn in the color of the most active chain