
Fig. 17.
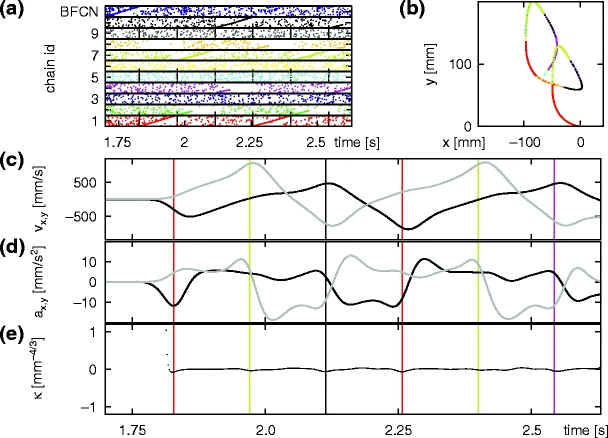
Equi-affine analysis of the generated trajectory. (a) Section of spike data shown in Fig. 16(a). Vertical dashed lines indicate the extent of individual synfire chain activities. (b) First section of the scribbling trajectory shown in Fig. 16(c), generated between 1.7 s and 2.7 s. (b) Velocity of the generated trajectory in the x (black) and y (gray) directions as functions of time. (c) Acceleration of the generated trajectory in the x (black) and y (gray) directions as functions of time. (d) Equi-affine curvature κ of the generated trajectory as a function of time. Colored vertical lines indicate the start of the corresponding parabolic primitive