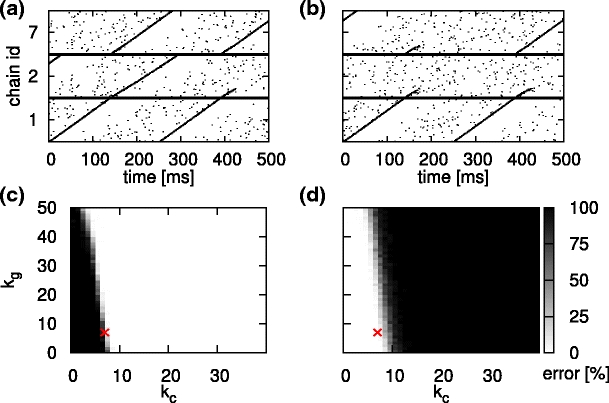
Fig. 8.

Switching errors as a function of the number of inhibitory cross connections k c and global inhibitory connections k g. (a) Spiking activity of a reduced network connected as 1→2,7 with k c = k g = 7. Activity of 10% of the neurons is shown. A switching error in which both successor chains are activated occurs at around t = 140 ms. (b) As in (a), but depicting a switching error in which neither successor chain is activated at around t = 140 ms. (c) Percentage of trials resulting in the activation of both successor chains as a function of the number of inhibitory cross connections (horizontal axis) and the number of global inhibitory connections (vertical axis). (d) As in (c) but for the case that neither of the successor chains is activated. The red cross indicates the chosen parameter set k c = k g = 7
