
Figure 2.
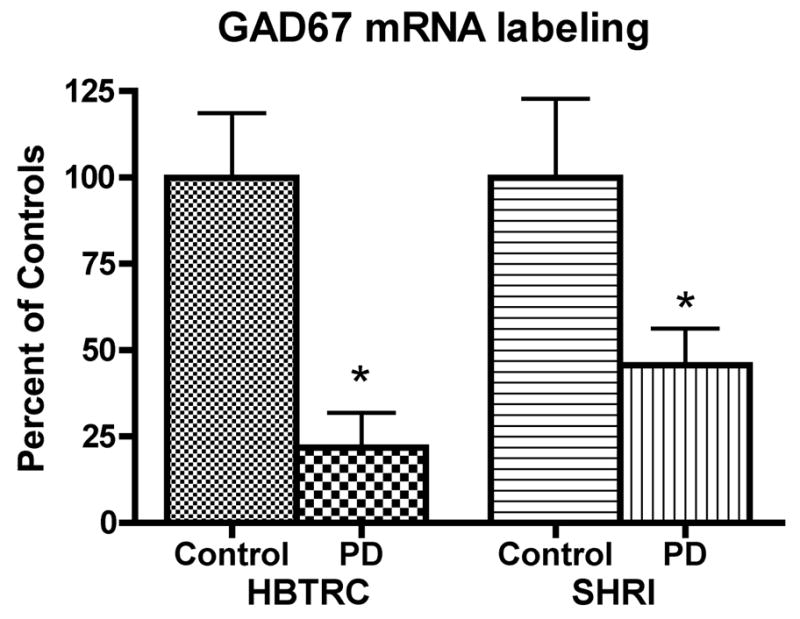
Relative levels of GAD67 mRNA labeling in prefrontal cortex BA9. Values represent the mean (±SEM) mRNA labeling measured on X-ray film radioautographs, and are expressed as percent of controls. For the HBTRC, data are from 8 controls and 8 PD cases. For the SHRI, data are from 12 controls and 11 PD cases (HBTRC: *p<0.005 vs. controls; SHRI: *p<0.05 vs. controls; two-tailed unpaired t-test).