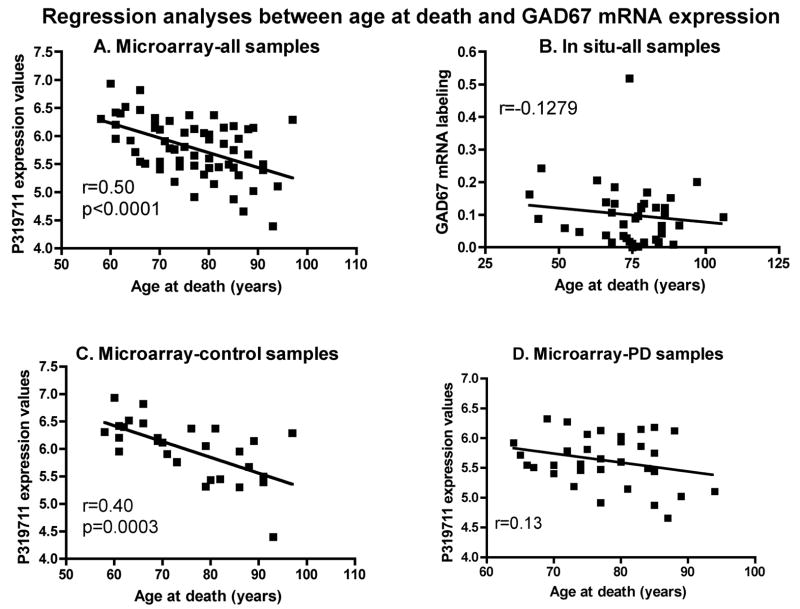
Figure 6.
Linear regression analyses between age at death and GAD67 mRNA expression include control and PD samples from the microarray (A, C and D) or in situ hybridization (B) experiments. Analyses using data from control and all samples from the microarray experiment show a highly significant correlation. r=Pearson Correlation Coefficient. Panel B: p=0.4379. Panel D: p=0.1346.

