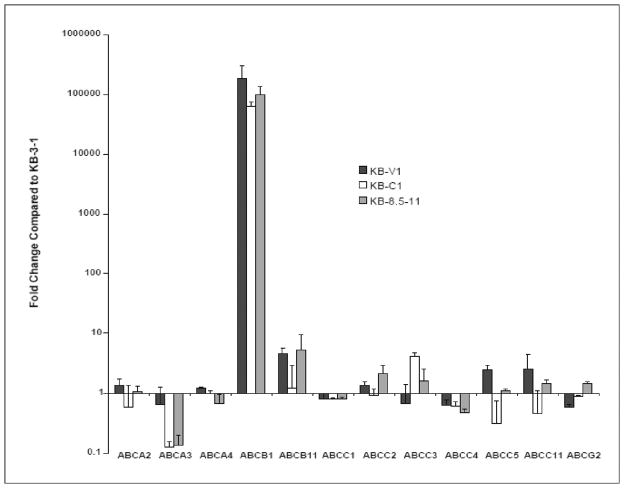
Fig. 2. Analysis of ABC transporter expression in multi-step selected KB sublines using SYBR Green qRT-PCR.
The delta-delta CT method was used to determine the fold change of ABC transporter gene expression in the multi-step selected KB sublines (17), compared to their parental line, KB-3-1. 300 ng of Total RNA used per reaction. Data were normalized to expression of the reference gene, plasma membrane Ca2+ ATPase 4 (PMCA4) (18). The values represent the mean and standard deviation (n=2). The 12 ABC transporters known to transport drugs are indicated on the X-axis. (Calcagno AM and Ambudkar SV, unpublished data).

